Let’s take a closer look at the real estate market data to understand the correlation between these key metrics.
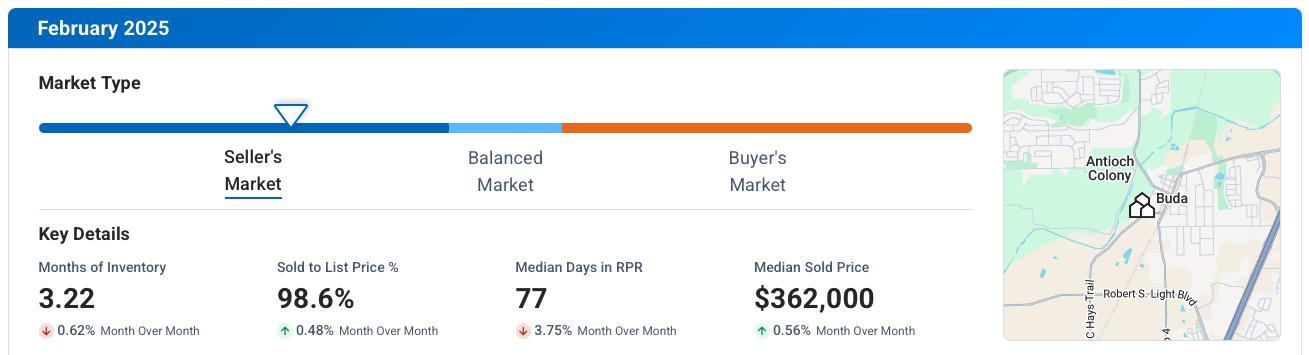
First, let’s consider the Months Supply of Inventory, which is currently at 3.22. This metric tells us how many months it would take to sell all the homes on the market at the current pace of sales. A lower number indicates a seller’s market, where demand exceeds supply.
Next, the 12-Month Change in Months of Inventory is up by 13.38%. This increase suggests that inventory levels have grown over the past year, which could indicate a shift towards a more balanced market or even a buyer’s market.
The Median Days Homes are On the Market is 77, which represents the average number of days it takes for a home to sell. A lower number typically indicates a fast-moving market with high demand.
The Sold to List Price Percentage is at 98.6%, showing that homes are selling very close to their asking price. This indicates strong buyer interest and competition in the market.
Finally, the Median Sold Price is $362,000, giving us an idea of the general price range of homes being sold in the area. This data point can help both buyers and sellers understand the current market value of properties.
Overall, the data suggests a market with relatively low inventory, high demand, and homes selling close to their listing prices. Buyers may face competition and need to act quickly, while sellers can expect their homes to sell at or near their asking price. It’s important for both buyers and sellers to stay informed about market trends and work with a knowledgeable real estate agent to navigate the current market conditions effectively.
If you would like to know more about what is happening in your particular area, let’s schedule some time to speak. Each market is different and there are micro markets that may provide additional insight. My team and I at Uncommon Realty are here to help you. I look forward to discussing what is going on with your area.